Whether you’re troubleshooting a network connectivity issue for a certain application and need to see if its port access is open, or if you want to see if your NAS device can interact with your Windows 10 PC, you’ll need to check for open ports.
A port is essentially an interface between your computer and the internet or other machines in the network. Because all communication over the internet is transferred over these ports, they are a crucial component of the whole internet communication architecture.
Each IP address contains 65,535 ports, which are either UDP or TCP. In a computer, an open port is one that is set to allow connections, whereas a closed port is one that refuses connections.
While open ports are required for internet connection, they might be dangerous if the service listening on the port has insufficient protection and is misconfigured. Ports that are left open are vulnerable to assault.
What is NetStat?
Netstat, which is derived from the words network and statistics, has long been available in Windows 10. It is a command-line tool that you use in Command Prompt (cmd.exe) to display statistics for all network connections.
This tool allows you to view a list of active networks (incoming and outgoing) connections as well as listening to ports. You may examine network adapter information as well as protocol statistics (such as IPv4 and IPv6). You may even see the current routing table, among other things. It enables you to monitor and solve networking problems for your system or apps by understanding open and connected ports.
How To Use Netstat Command On a Windows Computer
Follow these steps to get started with netstat:
If you’ve ever done any sort of coding, you’re familiar with the Command Prompt. The Command Prompt is an app installed on all Windows computers that lets you manage the computer using text commands.
The Command Prompt, unlike other programs, isn’t always easy to find. Command Prompt can be accessed in a number of different ways.
The quickest way to open the is to type “cmd” in the search bar, then choose it from the list. Select Run as administrator.

Once the Command Prompt is open, type “netstat-ano” and hit Enter. All open ports and active connections will be listed numerically, including the process id.
The details will be displayed in 5 columns:
- Protocols
- Local Address
- Foreign Address
- State
- PID (Process Identifier)

The state column shows if a port is open or not. Following are the possible states:
LISTENING indicates that it simply waits and is ready to respond whenever a client application requests it. When a client connects to that port, the connection is established and a dialogue begins.
ESTABLISHED indicates that a link has been made.
TIME_WAIT indicates that it is awaiting a response or connection.
CLOSE_WAIT indicates that the connection has been terminated on the other end.

This is basically how you check for open and closed ports in Windows.
Check what port a browser is using
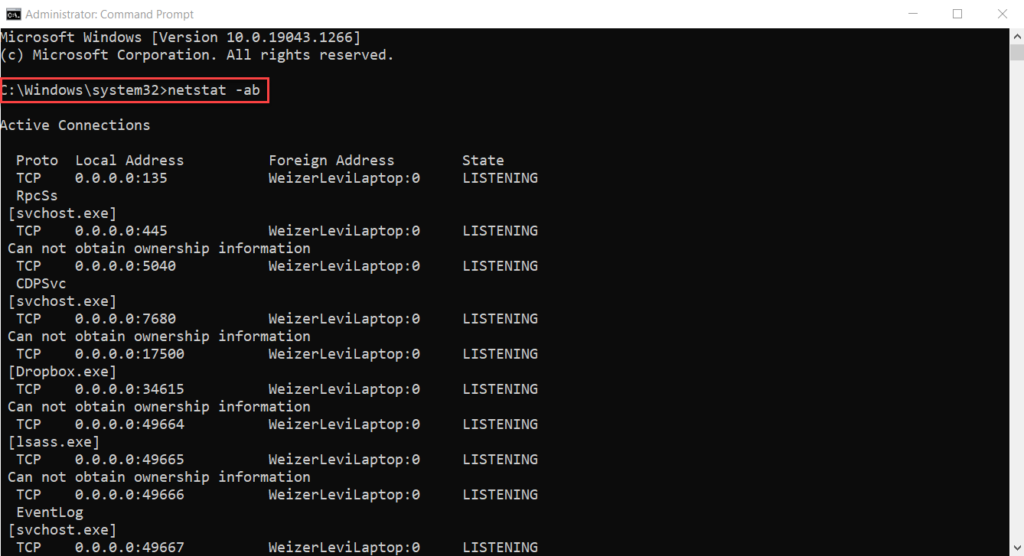
You can also view the port Firefox or any other browser or program is using. Using Command Prompt and type “netstat -ab”

Here we have the port Firefox is using.

Here is the Chrome port.

Check what port a service is using
With netstat we can also check what port a service is using.
In the Command Prompt type “netstat -ano” and hit Enter. Let’s check port 49667 and it’s PID (Process Identifier) 2180.

First we open task manager. Right-click any empty area on the taskbar and pick Task Manager from the menu that appears.


When we find our PID we see in the description tab that the Task Scheduler is using that particular port.

Netstat Command Reference
Netstat is a valuable network utility for analyzing network problems. Included below is a Netstat Command Reference.
netstat /?
Displays protocol statistics and current TCP/IP network connections.
NETSTAT [-a] [-b] [-e] [-f] [-n] [-o] [-p proto] [-r] [-s] [-t] [interval]
| -a | Displays all connections and listening ports. |
| -b | Displays the executable involved in creating each connection or listening port. In some cases well-known executables host multiple independent components, and in these cases the sequence of components involved in creating the connection or listening port is displayed. In this case the executable name is in [ ] at the bottom, on top is the component it called, and so forth until TCP/IP was reached. Note that this option can be time-consuming and will fail unless you have sufficient permissions. |
| -e | Displays Ethernet statistics. This may be combined with the -s option. |
| -f | Displays Fully Qualified Domain Names (FQDN) for foreign addresses. |
| -n | Displays addresses and port numbers in numerical form. |
| -o | Displays the owning process ID associated with each connection. |
| -p proto | Shows connections for the protocol specified by proto; proto may be any of: TCP, UDP, TCPv6, or UDPv6. If used with the -s option to display per-protocol statistics, proto may be any of: IP, IPv6, ICMP, ICMPv6, TCP, TCPv6, UDP, or UDPv6. |
| -r | Displays the routing table. |
| -s | Displays per-protocol statistics. By default, statistics are shown for IP, IPv6, ICMP, ICMPv6, TCP, TCPv6, UDP, and UDPv6; the -p option may be used to specify a subset of the default. |
| -t | Displays the current connection offload state. |
| interval | Redisplays selected statistics, pausing interval seconds between each display. Press CTRL+C to stop redisplaying statistics. If omitted, netstat will print the current configuration information once. |

